What Drives High Dividend Growth?
About the Video
A key difference between bonds and stocks is that bond income is fixed while stock dividends can change over time. The good news is that dividend increases are common and much more frequent than decreases.
What Drives High Dividend Growth?

Greg Powell: A key difference between bonds and stocks is that bond income is fixed while stock dividends can change over time. The good news is that dividend increases are common and much more frequent than decreases.

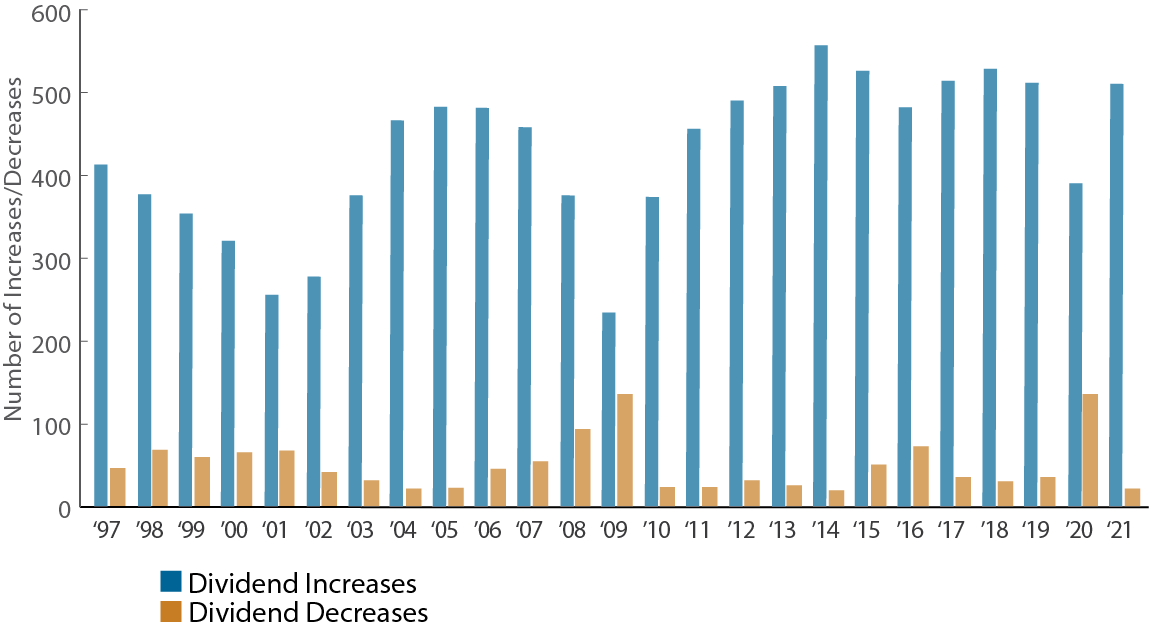
Dividend Increases and Decreases of the Russell 1000 Index

Twenty-five years as of December 31, 2021.
Sources: Bloomberg; Miller/Howard Research & Analysis.
See methodology at the end of this presentation.

Looking at the stocks in the Russell 1000 Index over the past 25 years, on average 427 companies increased their dividend each year, while only 52 cut their dividend. Naturally, there are more decreases during difficult years such the end of the Internet Bubble, the Global Financial Crisis, and the pandemic. But even in these challenging years, increases still strongly outpaced decreases.

At Miller/Howard, we are dedicated to increasing the income our clients earn from their portfolios. Our strategy is to avoid decreases as well as tilting towards companies likely to make large dividend increases.
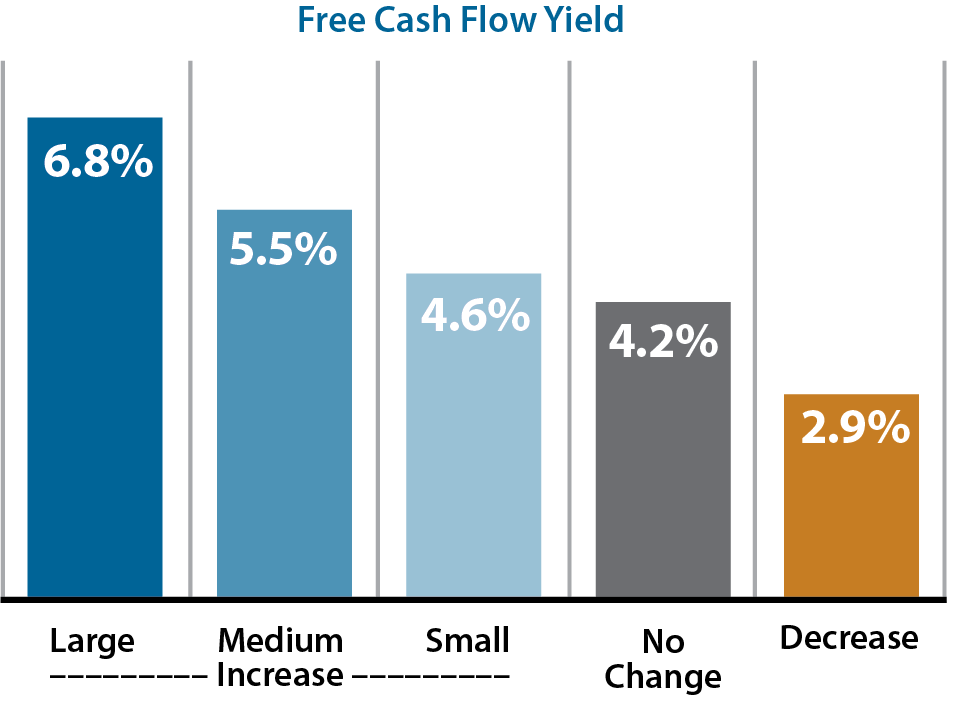
Growth versus Dividend Changes

Twenty-five years as of September 30, 2022.
Sources: Bloomberg; Miller/Howard Research & Analysis. Increases: Large >50bps; Medium 26-50bps; Small <26bps.
Free Cash Flow (FCF) Yield is calculated using the trailing 12-month FCF andprice as of end of calendar year selection dates for dividend payers in the Russell 1000 Index. For FCF Yield, financials, real estate, and utilities (as definedby Eikon) are excluded as it is not a meaningful metric for those sectors. See methodology at the end of this presentation.

We recently examined the dividend behavior of the companies in the Russell 1000 over the past 25 years to determine what financial characteristics best predict dividend behavior.

For the core of the market (which excludes financials, real estate, and utilities), we have found that the best valuation metric for predicting large dividend increases was free cash flow yield, defined as cash flow from operations less capital spending, divided by market capitalization. Free cash flow represents the actual cash that is available to pay dividends, reduce debt, or buy back shares. When we examine our database of Russell 1000 dividend decisions, we see that the largest dividend increasers had the highest average free cash flow yield in the preceding year, while dividend cutters had the lowest.

One of the key tenets of income investing is that dividends are dependable because management teams are loath to cut dividends. We have seen that dividend decreases do occur every year, but historically they are outnumbered by increases by roughly eight-to-one. In general, management teams are doing a good job of looking ahead, and largely avoiding increases that have to be reversed in a future year.
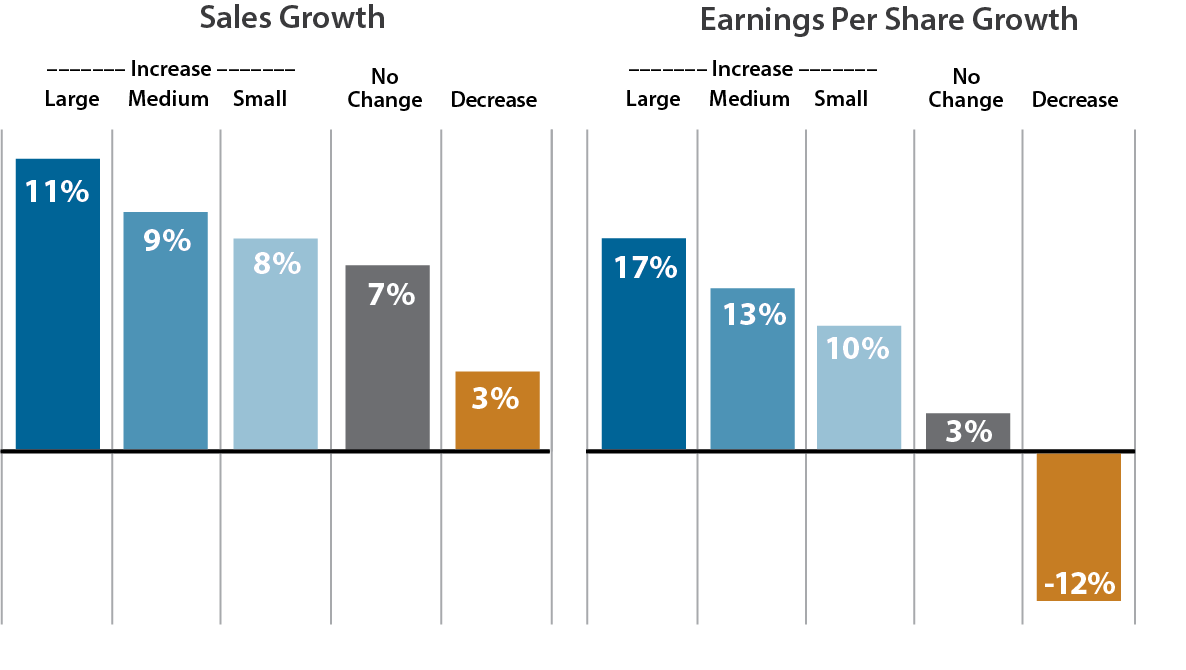
Valuation versus Dividend Changes

Twenty-five years as of December 31, 2021.
Sources: Bloomberg; Miller/Howard Research & Analysis. Increases: Large >50bps; Medium 26-50bps; Small <26bps.
Outliers with growth values exceeding +/-100% are winsorized. See methodology at the end of this presentation.

One possible way management teams can avoid dividend cuts is by raising dividends only when their business is actually growing. We found that both revenue growth and earnings per share growth are useful in predicting the size of dividend increases. Large dividend increases averaged the highest growth of both revenue and earnings per share while dividend cutters had the lowest growth.

Our overall conclusion is that dividend behavior is tightly linked to strong fundamentals:

  • High Free Cash Flow Yield
  • Growing EPS
  • Growing Sales
  • and Low Debt

In essence, the companies in a good equity income strategy are healthy, growing businesses. They have to be in order to meet their dividend commitments.

To learn more about this study and why we think dividends are important, please see our website mhinvest.com.

Methodology for Charts: We screened for members of the Russell 1000 Index by Calendar Year end-date beginning in 1997. Among dividend paying members of the resulting universe, an annualized dividend was calculated for both the year and the prior year based on the fourth quarter dividend paid for year one and year minus one (fourth quarter dividend multiplied by 4). To calculate the change in yield, the calendar year end date price was used. For example: For 2021 data, we screened for members of the Russell 1000 Index as of 12/31/2020. For each dividend payer in the resulting universe, the 2021 Q4 dividend was multiplied by 4 as well as the previous period dividend (2020 Q4). The formula to calculate change in basis points was ((2021 Q4 dividend*4)-(2020Q4 dividend*4))/2020 calendar year end price. For annual payers, the annual dividend and prior annual dividend were compared. For semi-annual payers, the second dividend paid was multiplied by 2 rather than 4. Specials were excluded from all calculations. Calendar Years 2012 and 2013 were modified to adjust for dividend actions taken by companies in response to changes in tax laws around dividends.

DISCLOSURE

INVESTMENT PRODUCTS: ARE NOT FDIC INSURED - MAY LOSE VALUE - ARE NOT BANK GUARANTEED

Opinions and estimates offered constitute Miller/Howard Investments' judgment and are subject to change without notice, as are statements of financial market trends, which are based on current market conditions. Nothing stated herein, including the mention of specific company names, should be construed as a recommendation to buy, hold, or sell any security, sector, or MLPs in general. To receive a list of all recommendations for the previous year, please email compliance@mhinvest.com. All investments carry a certain degree of risk, including possible loss of principal. It is important to note that there are risks inherent in any investment and there can be no assurance that any asset class will provide positive performance over any period of time. The material may also contain forward-looking statements that involve risk and uncertainty, and there is no guarantee they will come to pass.

Common stocks do not assure dividend payments. Dividends are paid only when declared by an issuer’s board of directors, and the amount of any dividend may vary over time. Dividend yield is one component of performance and should not be the only consideration for investment.

The information above is from sources deemed to be reliable and is provided strictly for the convenience of our investors and their advisors. These materials are solely informational. Legal, accounting and tax restrictions, transaction costs, and changes to any assumptions may significantly affect the economics of any transaction.

The information and analyses contained herein are not intended as tax, legal, or investment advice and may not be appropriate for your specific circumstances; accordingly, you should consult your own tax, legal, investment, or other advisors, at both the outset of any transaction and on an ongoing basis, to determine such appropriateness. Any investment returns — past, hypothetical, or otherwise — are not indicative of future performance.

Investment Decisions: Do not use this report as the sole basis for investment decisions. Do not select an allocation, investment discipline, or investment manager based on performance alone. Consider, in addition to performance results, other relevant information about each investment manager, as well as matters such as your investment objectives, risk tolerance, and investment time horizon.

The returns on a portfolio that utilizes environmental, social, or governance (ESG) criteria for stock selection may be lower or higher than portfolios where ESG factors are not considered, and the investment opportunities available to such portfolios may differ.

Past performance does not guarantee future results.

© 2024 Miller/Howard Investments.