Do Unprofitable Companies Belong in Your Portfolio?
Wednesday, June 30, 2021

 Income investing does involve having general views on the future, but ultimate success is much more dependent on the power of compounding than 20/20 foresight.
Do Unprofitable Companies Belong in Your Portfolio?
Most investors saving for retirement would answer, “Surely not!” And yet, turn on any business channel and you will hear experts lauding the shining future of various growth and small-cap stocks. Many of these stocks have positive and growing earnings, but a surprising number are currently losing money. In the Russell 1000 Growth Index, 23% lost money last year. In the small-cap Russell 2000 Index, fully 47% were unprofitable in 2020. Even 16% of the S&P 500 Index names were unprofitable last year. Unprofitable companies are so ubiquitous that they can be found in virtually all retirement accounts, particularly for investors using passive funds or ETFs.
This is not just an artifact of the pandemic. The chart below shows the fraction of unprofitable companies in the S&P 500, Russell 1000 Growth, and Russell 2000 indices over the last 25 years. As you can see, unprofitability rises in times of stress such as the end of the Internet Bubble, the Global Financial Crisis, and the COVID-19 pandemic. But the fraction of companies losing money in the broad market (as represented by the S&P 500) is persistently high. Among small-cap stocks, the percent of unprofitable companies has been trending up, reaching almost half of the Russell 2000 Index by weight. It seems unlikely that the average saver would be comfortable investing in unprofitable companies to this extent.
Many investors will try to comfort themselves with the notion that GAAP accounting is inherently conservative and includes many one-time, non-cash charges. At Miller/Howard, we are sympathetic to this viewpoint and focus mainly on free cash flow (FCF) as our profit metric. Free cash flow is defined as operating cash flow less capital expenditure. It’s the ultimate “show me the money” metric in that it reflects the actual cash a company generates that can be used for dividends, share buybacks, strengthening the balance sheet, or acquisitions.

As of December 31, 2020. Source: Bloomberg.
*TTM = Twelve Trailing Months; EPS = Earnings Per Share The universes are defined as members of the listed indexes
(Russell 2000, Russell 1000 Growth, S&P 500) as of each calendar year end and are market-cap weighted.
GAAP = Generally Accepted Accounting Principles

As of December 31, 2020. Source: Bloomberg. Free cash flow is defined as operating cash flow less capital expenditure.
The universes are defined as members of the listed indexes (Russell 2000, Russell 1000 Growth, S&P 500) as of each calendar year end and are market-cap weighted.
As the chart above shows, a significant percentage of stocks in the broad market have negative free cash flow. For small-cap stocks, roughly one-third of companies are investing more capital than operations generate. Even for the S&P 500, over 10% of the companies in the index have been free cash flow negative in recent years. For one unique sector of the economy, regulated utilities, negative free cash flow is not a significant concern. Utilities can invest more than their operating cash flow knowing that regulators will ensure that investment returns will indeed follow. In contrast, the vast majority of companies invest without guaranteed returns. Running with negative free cash flow means that executives are “betting the firm” with capital expenditures, depending on either good returns or the continued willingness of investors to inject new equity or debt capital.
Our view at Miller/Howard has always been that people saving for retirement are best served by investing in mature, self-sustaining companies—companies with enough free cash flow to fund a large and growing dividend. We would argue that venture capitalists are the right investors for young, money-losing enterprises. These sophisticated investors have greater access to management and detailed company information—much more access than any equity investor in a public company. Ideally, companies become profitable and then go public, but the rush to “cash out” has pushed moneylosing companies into the public markets and thus into investors’ portfolios. Is this a good thing?
Succeeding with Business Startups
Many people become wealthy by starting their own business, which, no doubt, has an unprofitable phase. Others do well by investing in small businesses started by friends or family members. But if your favorite niece or nephew is not destined to start the next mega-cap growth company, can you reliably buy stocks to replicate that type of opportunity? Is investing in unprofitable public companies a good investment strategy?
Unprofitable Companies vs Profitable Companies
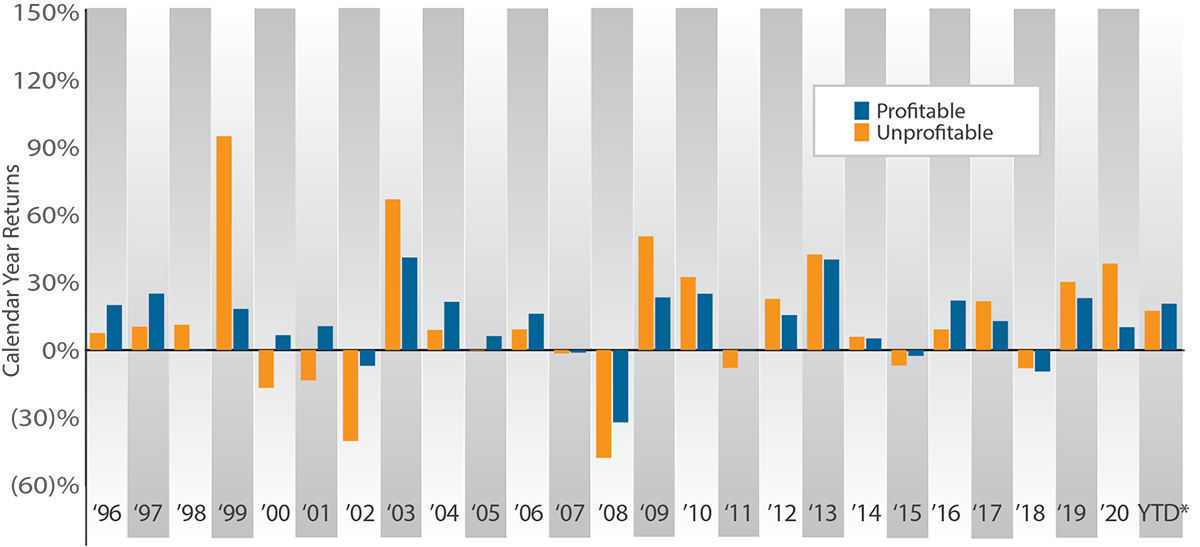
*As of June 30, 2021. Source: Bloomberg; Miller/Howard Research & Analysis.
To answer these questions, we first looked at investing in small-cap stocks—surely this is where money-losing acorns may grow to mighty oaks. The chart above shows the results of investing in unprofitable companies versus profitable small-cap companies in the Russell 2000 Index. As you can see, investing in unprofitable companies worked well just as the Internet/New Economy Bubble was coming to an end, then did well again in the market recovery years of 2003 and 2009, and then had an excellent 2020. But the chart below shows that on a cumulative basis, there is no contest—investing in profitable small-cap companies has generated much higher cumulative returns.
Unprofitable Companies vs Profitable Companies
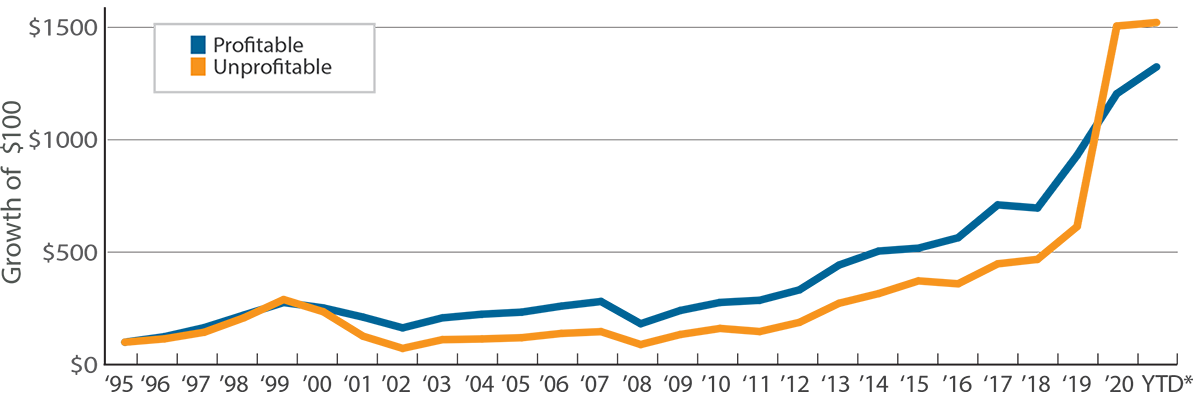
*As of June 30, 2021. Source: Bloomberg; Miller/Howard Research & Analysis.
Note for charts on this page: Unprofitable is defined as members of the Russell 2000 Index with negative trailing earnings per share as of each calendar year end. Profitable is defined as members of the Russell 2000 Index with positive trailing earnings per share as of each calendar year end. Both Unprofitable and Profitable are market capitalization weighted and rebalanced at year-end.
A skeptic might argue that a broad market index of small-cap stocks is not the right place to look for the next big thing. The two charts below show the results of investing in profitable versus unprofitable companies within the Russell 1000 Growth Index. Investing in unprofitable growth companies during 1995-2019 would have led to significant underperformance relative to owning profitable growth companies. Before 2020, the conclusion was clear: Within the growth stock universe, investing in profitable companies would be a better strategy. Results for 2020 were radically different—unprofitable growth companies outperformed profitable ones by such a magnitude that the cumulative returns for unprofitable companies are now above the returns for profitable growth companies. This year unprofitable companies are once again underperforming, and our view is that investing in money-losing public companies will ultimately prove to be unwise, regardless of recent results to the contrary.
Unprofitable Companies vs Profitable Companies
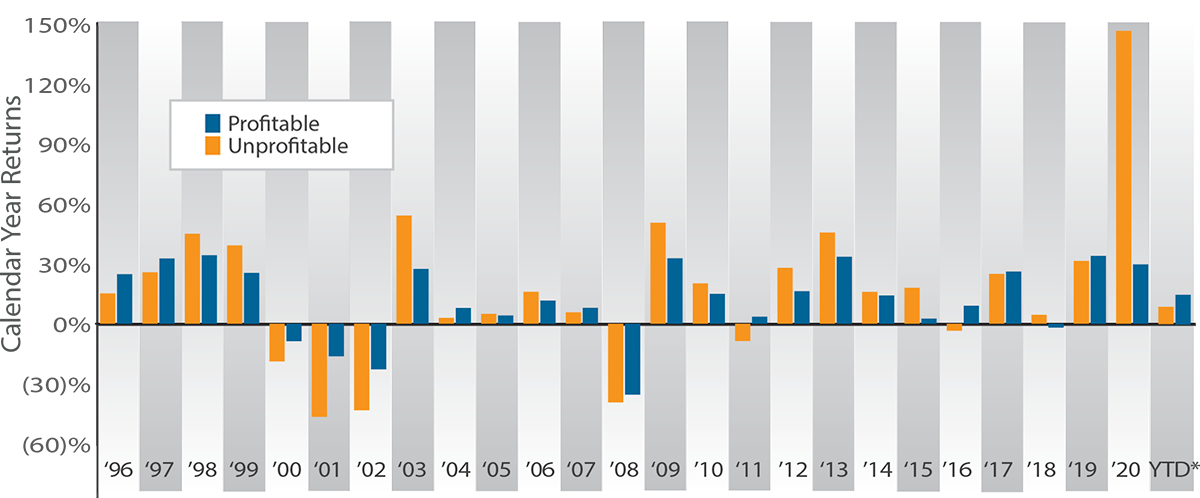
*As of June 30, 2021. Source: Bloomberg; Miller/Howard Research & Analysis.
Unprofitable Companies vs Profitable Companies

*As of June 30, 2021. Source: Bloomberg; Miller/Howard Research & Analysis.
Note for charts on this page: Unprofitable is defined as members of the Russell 1000 Growth Index with negative trailing earnings per share as of each calendar year end. Profitable is defined as members of the Russell 1000 Growth Index with positive trailing earnings per share as of each calendar year end. Both Unprofitable and Profitable are market capitalization weighted and rebalanced at year-end.
The Year of Speculation
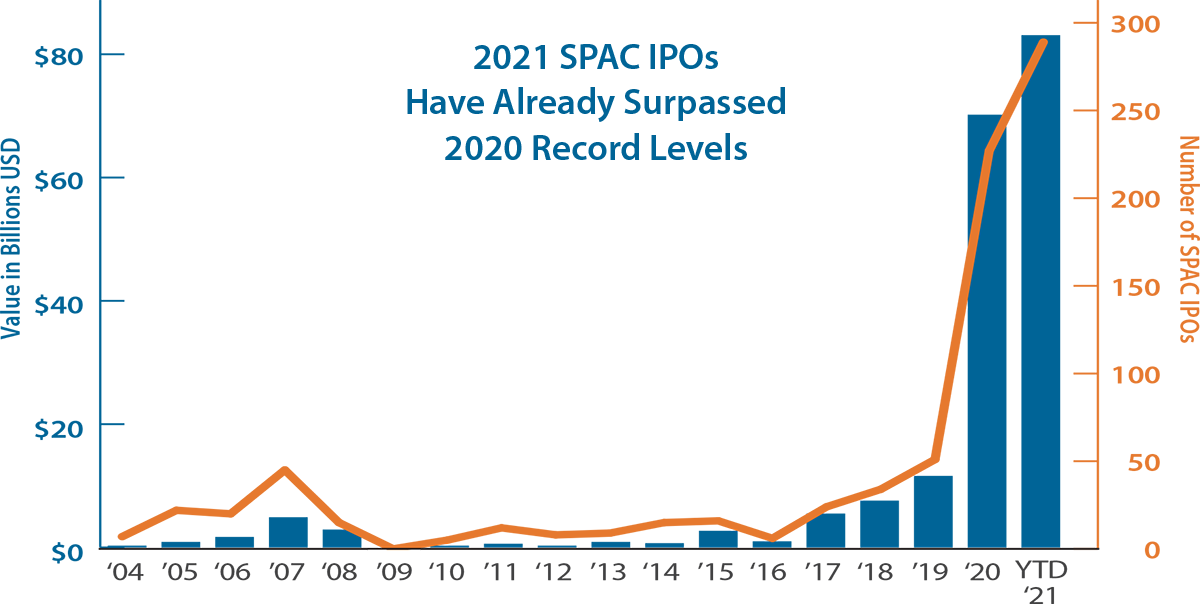
As of June 4, 2021. Source: Wolfe Research; Standard & Poor’s.
SPAC = Special purpose acquistion company; IPO = Initial public offering
The high returns for money-losing stocks in 2020 was just one more sign of the recent rise in speculation gripping the investment world. If you think this is just young people buying meme stocks based on social media posts, think again. Capital raised for Special Purpose Acquisition Companies (SPACs) soared last year, and the first half of 2021 has already surpassed the 2020 total. So far in 2021, more money has been raised for SPACs than regular IPOs. SPACs used to be called “blank check” companies, because capital was raised so that company executives could go shopping for acquisitions. Regulations have been tightened, but SPACs remain the exact opposite of investing in a known business with consistent cash flows.
But at least SPAC investors can hope that their investments might one day generate income. Cryptocurrency offers no such hope. Investors are lured into buying an asset that gyrates on investor moods and celebrity tweets. Is it more useful than currency for transactions? Probably not, after we set aside criminal activity. Is it a good store of value? The chart below says “no.” But like other popular speculative vehicles, it has made a lot of people rich recently. The time frame says it all—too many investors focus on what has worked recently, dismissing traditional wealth strategies with catch phrases such as, “You don’t get it” or its latest rendition, the pithy “Okay boomer.”
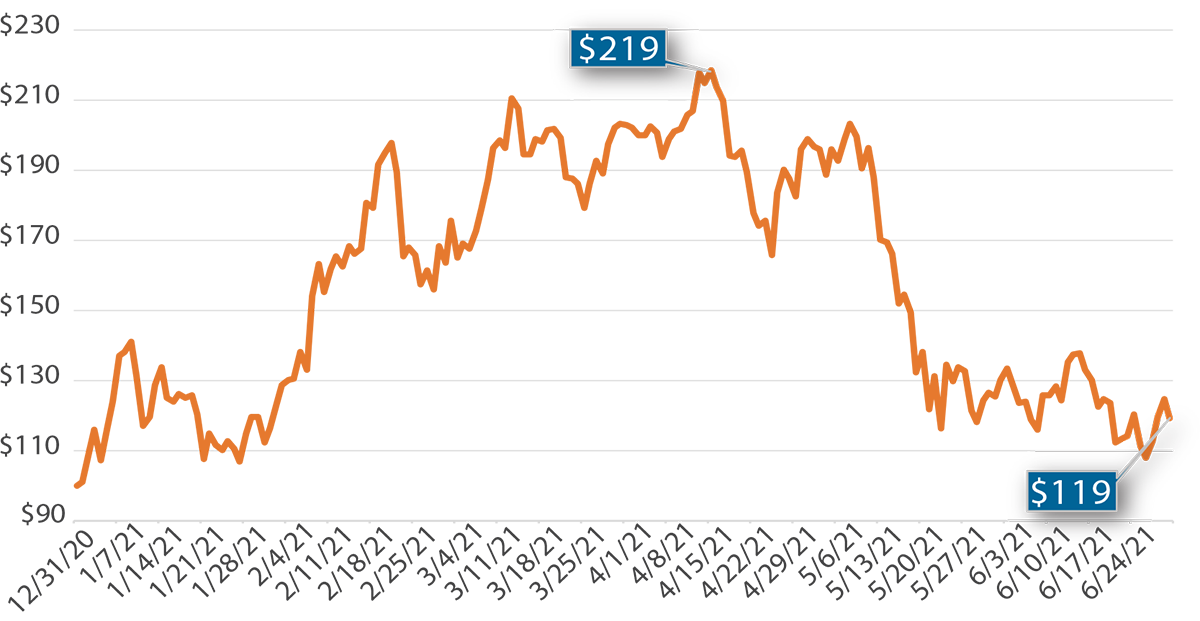
As of June 30, 2021. Source: Bloomberg
The Dividend Investor
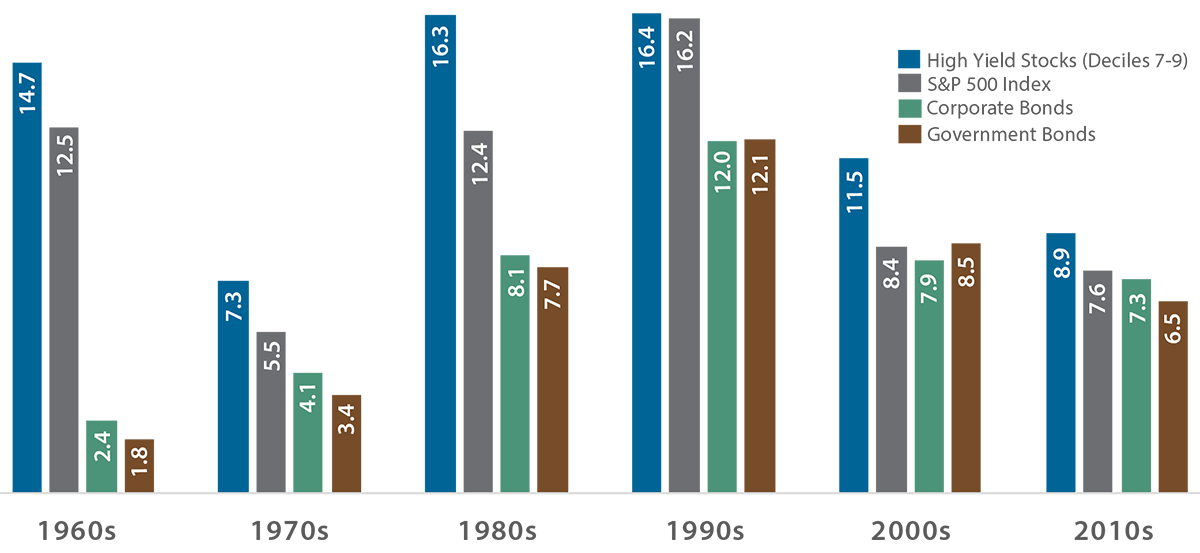
Data are through December 31, 2019. Based on the rolling 10-year annualized total returns, ending each calendar year, averaged by decade.
Source: Miller/Howard Research & Analysis; 2019 Stocks, Bonds, Bills and Inflation (“SBBI Yearbook”) and S&P 500 Index data as reported to Morningstar Direct. High Yield Stocks data are provided by the Fama/French Research data library (value weighted deciles); Long-term government and corporate bond returns are based on the SBBI Yearbook.
We have seen a move in the markets back towards value and income stocks, but the wide interest in SPACs, cryptocurrency, and meme stocks suggests that the speculative fever has not yet broken. When it does, we will no doubt hear stories of the winners. But what of the average saver who belatedly turns to the latest faddish asset just after its peak?
At Miller/Howard, we have long advocated high-yield dividend stocks for long-term investors. The stocks we choose for our portfolios tend to have reasonable price-to-earnings (P/E) multiples, good free cash flow, and relatively low debt levels. Studying unprofitable companies may seem odd given our investment discipline, but clients are always asking about our thoughts on the general market. We have written extensively about the outperformance of high P/E stocks prior to Pfizer’s vaccine announcement (see page 6 of our 1Q 2021 Quarterly Report). Unmentioned was the rocket-ship performance of companies that were not merely expensive on a P/E basis but actually losing money.
Using data going back to the 1950s, we have established that high-yield stocks have produced excellent returns for 10-year holding periods in every decade, better on average than the S&P 500 and better than bonds. (Please see Miller/Howard’s 2Q 2020 Quarterly Report for details.) Income investing works for the long term because, typically, companies must have durable, sustainable earnings to commit to a dividend.
Investing always involves risks, but good cash flow and earnings seems to be a logical place to start when researching a potential stock investment. In contrast, investing in unprofitable companies requires fairly heroic assumptions about the future. Income investing does involve having general views on the future, but ultimate success is much more dependent on the power of compounding than 20/20 foresight.
Better Earnings Outlook Driving Stocks Higher
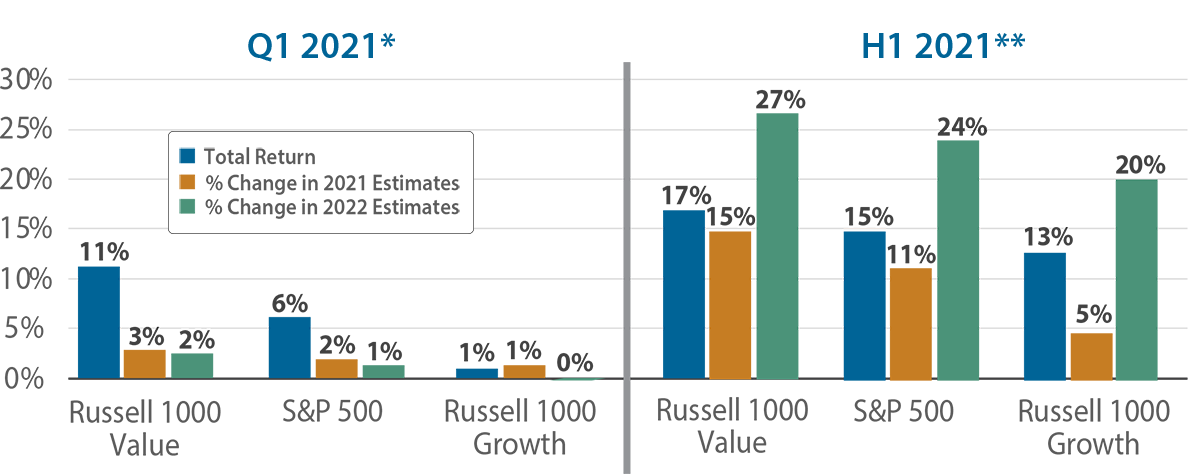
Market returns last year were driven largely by price-to-earnings (P/E) multiple expansion, as discussed in Miller/Howard’s 1Q 2021 Quarterly Report. The tenor of the market is changing this year, with the increase in earnings estimates becoming more important. This quarter, we witnessed very large increases in earnings estimates for both 2021 and 2022. Earnings estimates are up the most for cyclically-tilted value stocks. Consistent with the higher earnings estimates, value stocks have outperformed both the broad market and growth stocks year-to-date.
During the second quarter, growth stocks led value as many investors worried over the possibility of higher inflation and a potential reemergence of COVID-19 linked to new variants. Growth stocks are viewed as less dependent on economic growth and therefore more defensive. Growth stocks are now up 13% year-to-date, despite their 2021 earnings estimates being up only 5% in the same period. In contrast, value stocks are up 17%, close to the 15% increase in their 2021 estimates.
For the broad market, estimates for 2022 have risen 24% since the beginning of the year. There is a myth that “earnings estimates are always too high,” and this was clearly contradicted by the increases this year, with analysts scrambling to catch up with the improving economy. The estimates for 2022 may prove to be optimistic, but so far, they appear to reflect the vigorous reopening that many expect. If forecasted earnings growth materializes, it will provide a rationale for continued positive stock market returns without relying on multiple expansion.
Source: Bloomberg; Miller/Howard Research & Analysis.
*First Quarter of 2021: As of March 31, 2021; % Change in earnings estimates is between estimates as of 12/31/2020 vs. 3/31/2021.
**First Half of 2021: As of June 30, 2021; % Change in earnings estimates is between estimates as of 12/31/2020 vs. 6/30/2021.

Emeritus CIO
