Omicron and Inflation: How Strong Are the Headwinds?
Tuesday, February 01, 2022

Equity returns were robust in the fourth quarter, consistent with the arguments we made last quarter in The Case for Optimism. We pointed out that both the consumer and business sectors were in great shape, and low interest rates made bonds unattractive relative to equities. While we are still bullish on equities, recent developments regarding COVID-19 and inflation create headwinds for the stock market.
The rebounding economy has buoyed equities throughout the year, but investors toggled between growth and value stocks depending on COVID-19 headlines. Investors shifted towards value stocks late in 2020 with the vaccine announcements offering hope for a sharp economic recovery. Value’s outperformance continued during the first part of 2021, but the emergence of the Delta variant raised the specter of a more prolonged pandemic, boosting growth stocks.
Investors Toggled between Growth and Value Stocks
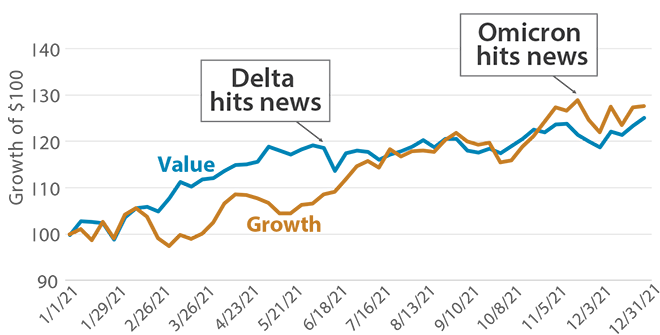
As of December 31, 2021. Sources: Bloomberg; Google Trends.
Total returns of the Russell 1000 Value Index and the Russell 1000 Growth Index.
The Omicron variant made headlines starting in mid-November, and the new variant quickly spread around the world. Prior to Omicron, there was hope that we were rapidly getting to the point where the vast majority of Americans would have immunity, either by vaccination, previous infection, or both.
The Omicron variant has upended this calculus given the widespread incidence of repeat cases and breakthrough infections. Omicron is so infectious that it looks like it will work through the population rapidly. Indeed, as of this writing, cases in South Africa—where Omicron was first reported—have already peaked, and hospitalizations and deaths are running below the levels seen in prior waves.
COVID-19 in South Africa
% of Delta Variant Peak
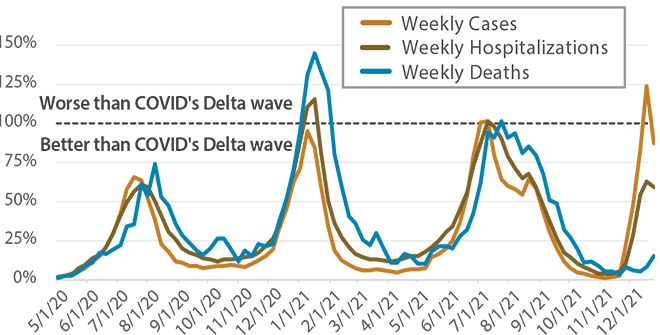
As of December 25, 2021. Sources: Johns Hopkins; Our World in Data.
Delta variant cases and hospitalizations peaked the week ended 7/10/21.
Deaths peaked the week ended 7/24/21
Experts have long expected COVID-19 to become endemic, meaning that the population has enough immunity through vaccinations and natural infection to keep the number of cases low, akin to the flu. Omicron may have restarted the clock, but its high transmissibility should shorten the course. In the meantime, physicians are much more knowledgeable about how to treat the disease, mitigating some of the worst consequences. In addition, both Pfizer and Merck have developed therapeutics that reduce the probability of severe disease if taken in the first few days following the onset of symptoms. Despite the daily barrage of negative headlines, we still believe that we are months, rather than years, away from the end of the pandemic dominating daily behavior.
Despite concerns regarding COVID-19, most economic activity has returned to normal. Looking at the use of trains, planes, and automobiles to move people and goods, we see that railroad usage never really dropped. Both miles driven and number of airport travelers fell dramatically during the early days of the pandemic, but now have largely returned to 2019 levels. Overall US Gross Domestic Product (GDP) is up, running 8% above 2019.
Trains, Planes, and Automobiles
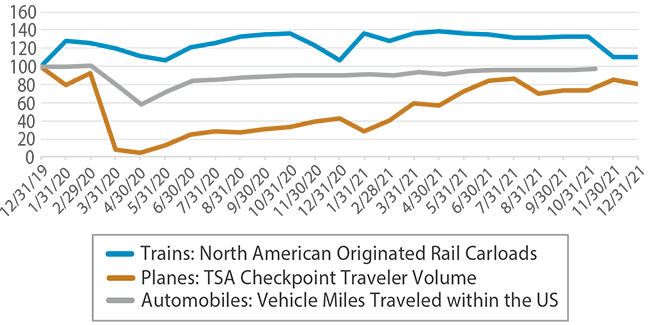
As of December 31, 2021. Sources: Bloomberg; US Department of Transportation; Association of American Railroads; Transportation & Security Administration. 12/31/19=100.
TSA Checkpoint Traveler Volume is the month-end 7-day rolling average of airline passenger throughput.
Rail Car and TSA Checkpoint data as of 12/31/2021. Vehicle Miles Traveled data as of 10/31/21.
Many parts of the economy continue to lag, reflecting the reality that the pandemic is still with us. Soft demand can be seen in low attendance at sporting events, half-empty restaurants and cinemas, and the continued struggle to sell passages on cruises. As the pandemic fades, we expect demand for experiences to rebound.
Kastle Back to Work Barometer*
Weekly
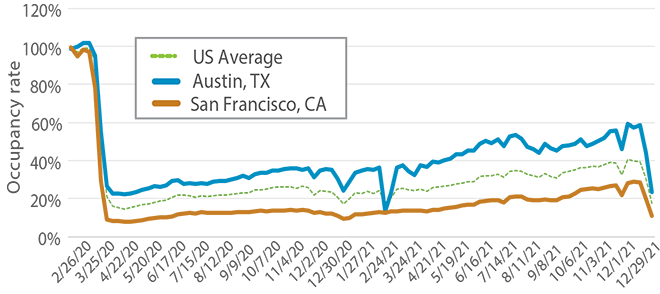
As of December 29, 2021. Source: Bloomberg.
* Displays commercial property occupancy rate based on entries in Kastle-secured buildings.
The one aspect of the economy that could be permanently changed is office work. On average, less than half of US office workers are back in the office. Results have varied by city, with office attendance typically highest in Austin and lowest in San Francisco. Even in Austin, the commercial property occupancy rate did not reach 60% of pre-pandemic levels before plummeting just ahead of the holiday season to under 25%.
Almost two years into the pandemic, this is remarkable especially considering how many other activities have returned to normal. Work from home seems to be here to stay. The shift to remote work has contributed to the tremendous growth in new business formation, more than ever witnessed in the United States.
US Business Formation Statistics:
Monthly Business Applications

As of November 30, 2021. Sources: Bloomberg; US Census Bureau.
Our conclusion is that the US economy has proven to be remarkably resilient. GDP growth has jumped back and unemployment continues to drop. Work from home is expected to unleash productivity gains, and the remaining pockets of demand weakness will provide opportunities for growth in a post-pandemic world.
The economy’s strong performance has translated into superb sales and profits. At the beginning of the year, Wall Street analysts were in a grim mood, forecasting S&P 500 Index earnings per share of $170 for 2021. This forecast proved to be overly pessimistic, with earnings for the almost-complete 2021 now expected to come in at almost $210 per share. Early forecasts were also wildly off for S&P 500 sales per share, now on track to be about 8% higher than initial estimates. Analysts are expecting 2022 to be only average in terms of sales and earnings per share growth, despite the strong starting point for both businesses and consumers (see Miller/Howard’s 3Q 2021 Quarterly Report). We believe 2022 forecasts will, again, prove to be overly pessimistic.
S&P 500: Earnings & Sales per Share
Since 1995
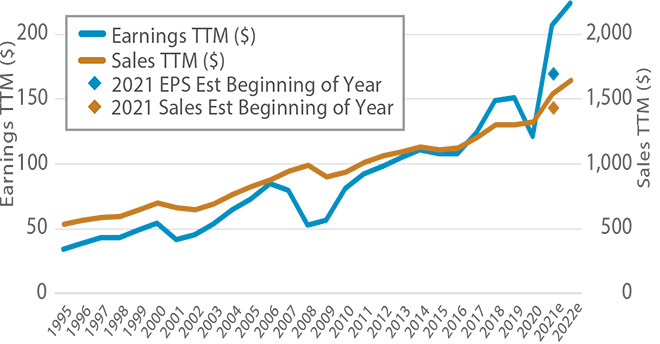
As of December 31, 2021. Source: Bloomberg.
Earnings expansion was the principal driver of stock market returns in 2021. The increase in earnings estimates was largest for value stocks, but the impact was somewhat offset by a fairly large contraction in price-to-earnings multiples (P/E). Despite outstanding returns in 2021, stocks in the Russell 1000 Value Index are entering 2022 with substantially lower P/E multiples—a good set up for the coming year, in our view. In contrast, Russell 1000 Growth Index earnings estimates increased less than those of value stocks over the year, yet growth stocks outperformed because their P/E multiples contracted minimally compared to value stocks.
2021 Total Return Composition
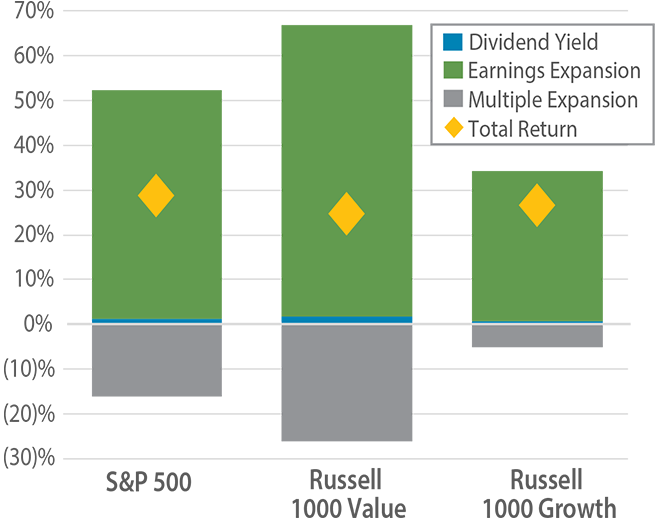
As of December 31, 2021. Sources: Bloomberg; Miller/Howard Research & Analysis.
The battle between growth and value will hinge mainly on inflation, both how it evolves and how the Federal Reserve reacts. The ideal environment for value stocks, in our view, would be a growing economy accompanied by moderate inflation with higher interest rates, both at the short and long end of the yield curve. This would cause investors to put a greater discount on distant earnings, placing more emphasis on near-term earnings—to the benefit of value stocks. Higher interest rates would also give a substantial boost to financial stocks which are far more prevalent in the value benchmark.
The most likely scenarios in which growth stocks outperform would be a material extension in the pandemic or a policy error by the Fed that pushes the economy into a recession. Since so much of the uncertainty hinges on inflation, let’s take a closer look at the recent spike.
Inflation Spiked in 4Q 2021
Jan 1970–Nov 2021
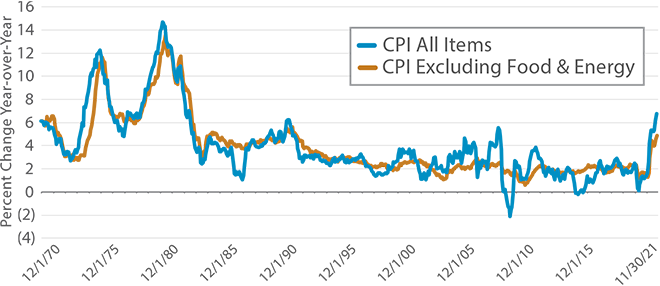
As of November 30, 2021.
Source: Bloomberg; Bureau of Labor Statistics.
CPI = Consumer Price Index.
Inflation spiked to 6.8% in November, the highest reading since the early 1980s. The core Consumer Price Index (CPI), meaning excluding food and energy, also increased to a level not seen since the early 1990s. The persistent and widespread inflation has caused the Fed to stop using “transitory” as a descriptor.
Contribution to Inflation
Year-Over-Year CPI Growth: 6.8%
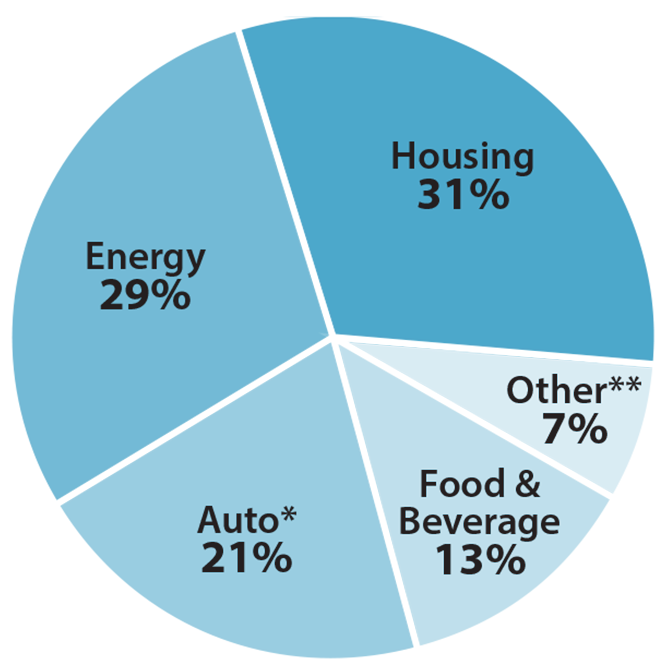
As of November 30, 2021.
Sources: US Bureau of Labor Statistics; Federal Reserve Economic Data (FRED), created and maintained by the Research Department at the Federal Reserve Bank of St. Louis; Miller/Howard Research & Analysis.
* Auto combines categories New Vehicles, Used Cars and Trucks, Motor Vehicle Maintenance and Repair, and Motor Vehicle Parts and equipment as provided by the US Bureau of Labor Statistics.
** Other is all remaining CPI categories after removing categories Housing, Energy, Auto*, and Food & Beverage as provided by the US Bureau of Labor Statistics.
The largest contributor to the recent run-up in inflation has been the cost of housing. For owner-occupied units, the CPI is based on a survey question on what owners think they could get in rent for their homes. The Zillow Rent Index is constructed using actual rent data and is probably a more accurate measure of housing inflation, suggesting that the CPI is understating this important category. Given that it will take a substantial amount of time for housing supply to catch up with demand, we expect this component of inflation to be with us for a while.
Housing Cost Inflation
Housing CPI vs Zillow Rent Index
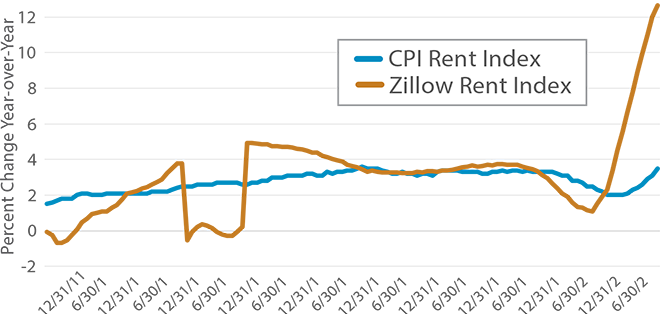
As of November 30, 2021.
Sources: Bloomberg; US Bureau of Labor Statistics.
CPI Rent Index definition: For an owner-occupied unit, the cost of shelter is the implicit rent that owner occupants would have to pay if they were renting their homes. Owner Equivalent Rent, or OER, is based on the following question that the Consumer Expenditure Survey asks of consumers who own their primary residence: “If someone were to rent your home today, how much do you think it would rent for monthly, unfurnished and without utilities?”
We feel that the other major contributors—energy, automobiles, and food & beverage—are more likely to be transitory. Energy prices are notoriously volatile, and higher prices historically bring on more supply, particularly from US shale basins that require short lead times.
We believe that some of the inflation we are seeing today has been caused by supply disruptions in the economy. Some of these can be traced directly to the pandemic—for example, many semiconductor plants had to be closed temporarily following outbreaks of COVID-19. Other bottlenecks are indirect but nonetheless significant. COVID-19 shifted consumer spending from services to hard goods, much of which come from Asia. Bottlenecks in both shipping and trucking have led to shortages at retailers. As a result, the normal mechanism of supply and demand has pushed prices up, but we should expect this aspect of inflation to reverse as supply bounces back.
Container Ships Waiting
at the Ports of Los Angeles and Long Beach
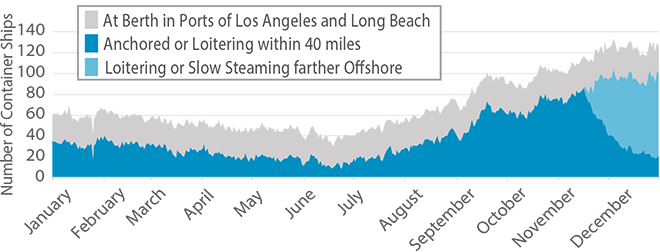
Data from January 1, 2021 to December 31, 2021. Source: Marine Exchange of Southern California.
Parts shortages have caused auto production to plunge, leading to extremely low inventories on dealer lots. Customers have bid up the prices of both new and used vehicles, with the spike in used car prices being the largest ever. The increase in both new and used auto prices has been an important part of the inflation spike. We expect this to prove transitory once supply conditions normalize.
Domestic US Auto Production & YoY Change in Used Vehicle Value
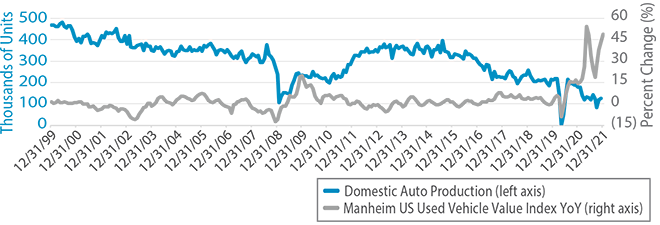
Manheim Index as of 12/31/21. Auto Production as of 11/30/21.
Sources: Bloomberg; US Bureau of Economic Analysis.
Domestic auto production is defined as all autos assembled within the US on a monthly basis.
Inventory/Sales Ratio for the Domestic US Auto Industry

As of November 30, 2021. Sources: Bloomberg; US Bureau of Economic Analysis.
Inventory is defined as the domestic US unit inventory of new vehicles assembled in the US, Canada, or Mexico. Sales is defined as domestic US unit sales of new vehicles assembled in the US, Canada, and Mexico on a monthly basis. Excludes vehicles produced elsewhere and exports.
The best argument for a portion of inflation being more than merely transitory is the unprecedented monetary and fiscal stimulus that has been used to offset the economic impact of the pandemic. Critics argue that this stimulus will overheat the economy, resulting in inflation.
Federal COVID-19 Stimulus and Relief Packages

As of December 31, 2021. Source: Miller/Howard Research & Analysis. Cumulative aid is displayed as a % of 2020 GDP.
There is no debating that the stimulus was massive. The Fed dropped the federal funds rate in two steps in March 2020, going from a target range of 1.50-1.75% to 0-0.25% in total, representing a dramatic decrease in the cost of bank funding. The purpose of the decrease was to encourage bank lending. The Fed also rapidly grew its balance sheet by increasing bond purchases and upping its repo program. Combined, these moves reduced interest rates and increased liquidity. The Fed also engaged in direct lending through several programs, with the Paycheck Protection Program (PPP) loans being the most prominent.
Fiscal stimulus to address the fallout from the pandemic was also massive, with additional spending totaling more than a quarter of a 2020’s GDP. Bills passed in 2020 and 2021 provided a panoply of programs including direct cash payments, expanded unemployment benefits, mortgage and student loan forbearance, interest moratoriums, and grants to state and local governments, hospital, universities, transportation systems, and so on. It’s worth pointing out that inflation hawks have been warning for decades that deficit spending would result in a return of 1970s inflation. These predictions have been dead wrong up until now, but the hawks may be right this time given the unprecedented fiscal and monetary stimulus.
Monetary Stimulus during the COVID-19 Pandemic
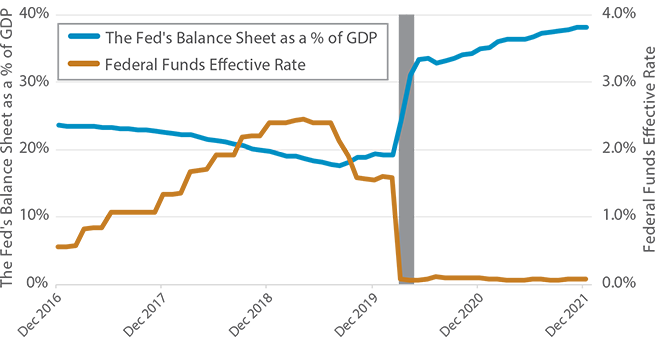
As of December 31, 2021. Sources: Bloomberg; Federal Reserve Bank of NY.
The grey bar represents a recessionary period as designated by the Federal Reserve.
Higher inflation is a real possibility, so we must ask, “How will it affect our investments?”
Clients tend to worry that the companies in our portfolios will be unable to pass along cost inflation. The truth is that any well-diversified portfolio will have some companies that benefit from inflation and others that are hurt—one firm’s product is another firm’s cost. We looked at year-over-year changes in gross margins for sectors in the S&P 500 to see how well firms passed along cost inflation in the third quarter. While there were some sectors that faced difficulties, S&P 500 companies (excluding financials, real estate, and utilities) grew gross margins in 3Q 2021, meaning revenues grew faster than the cost of goods sold. Despite occasional variation, firms will generally raise prices in line with inflation. Even firms in highly competitive industries will see prices go up as inflation drives costs up for all competitors.
Change in Gross Margin by Industry
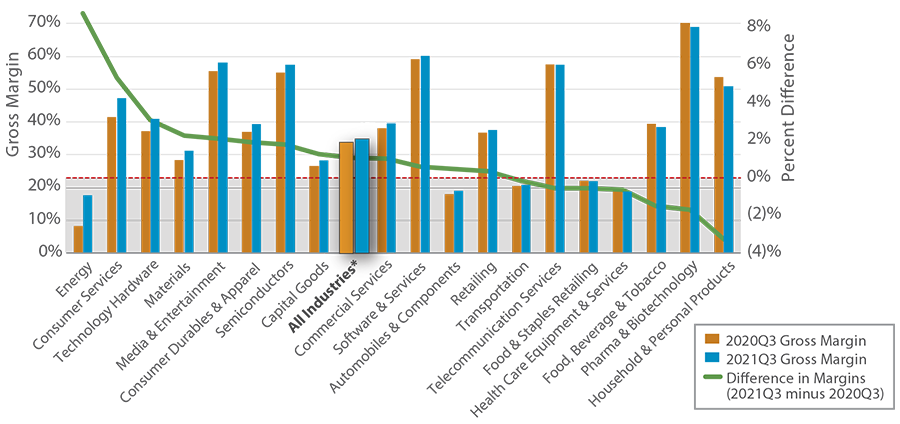
As of December 2021. Sources: Bloomberg; Miller/Howard Research & Analysis.
* Industry excludes members of GICS Sector Classifications Financials, Real Estate, and Utilities as gross margin is less meaningful for these sectors. Industry members are based on members of the S&P 500 Index as of the comparison dates. Industry clasification is based on GICS. Members with missing data have been excluded from totals.
In contrast to equities, most bonds cannot adjust for inflation. A bond promises a fixed coupon. Outside of the inflation-indexed niche, bonds will continue to yield a fixed return even when inflation is eroding away the coupon’s value.
The best equity valuation metric to compare to bond yields is the earnings yield, or the inverse of a price/earnings multiple. This represents the return a company earns relative to the price of the stock. We prefer companies that pay out a healthy portion of their earnings as dividends, but retained earnings are also valuable as they can be reinvested to grow future earnings and dividends.
Currently, the S&P 500 has a forward earnings yield of roughly 4.7%, well above the 1.5% yield on the 10-year Treasury. Looking back at all rolling 10-year investment periods starting in 1955, the S&P 500 has grown earnings 100% of the time. Equities offer a higher earnings yield plus a strong probability of growth in earnings over long investment periods. The threat of inflation only improves the case for equities, as companies serve as pass-through vehicles for higher prices, while bond investors are stuck clipping coupons that are declining in real value.
The stock market is still dominated by growth companies selling at high P/Es—multiples that can only be justified by forecasts for rapid earnings growth far into the future. At Miller/Howard, we prefer stocks with lower valuations than the broad market combined with a healthy portion of earnings being returned to investors in the form of dividends. Focusing on higher earnings now with higher dividends now makes our portfolios much less dependent on earnings forecasted for 2030 and beyond. If the pandemic and the resulting spike in inflation have taught us anything, it’s that forecasting is difficult. Our approach for navigating this uncertainty is to focus on companies with strong balance sheets, good dividend yields, and an outlook for dividend growth that is not dependent on overly aggressive forecasts.
Read the 4Q 2021 Quarterly Report ►

Emeritus CIO
