Free Cash Flow in Midstream Energy
About the Video
Free cash flow is a very important metric for investors; however, one that was often overlooked during the midstream build-out during the shale boom. But now this metric has become the focus for the midstream sector. Why should investors be paying attention?
Free Cash Flow in Midstream Energy

John R. Cusick, CFA: Free cash flow. That’s the amount of cash that is left over from cash from operations after deducting for capital expenditures. It’s a very important metric for investors; however, one that was often overlooked during the midstream build-out during the shale boom. But now this metric has become the focus for the midstream sector.

Midstream Universe: Cash Flow
Shown in USD Billions
Midstream Universe: Cash Flow

As of December 31, 2021. Sources: Bloomberg; Miller/Howard Research & Analysis. For illustrative purposes, 2021 data has been compared against 2015, which was the most recent trough for the midstream industry’s free cash flow. The Midstream Universe includes MLP and C-corps with operations primarily in the transportation and storage of crude oil, natural gas, natural gas liquids, and refined products. As of March 2022, there were 54 companies in the universe.

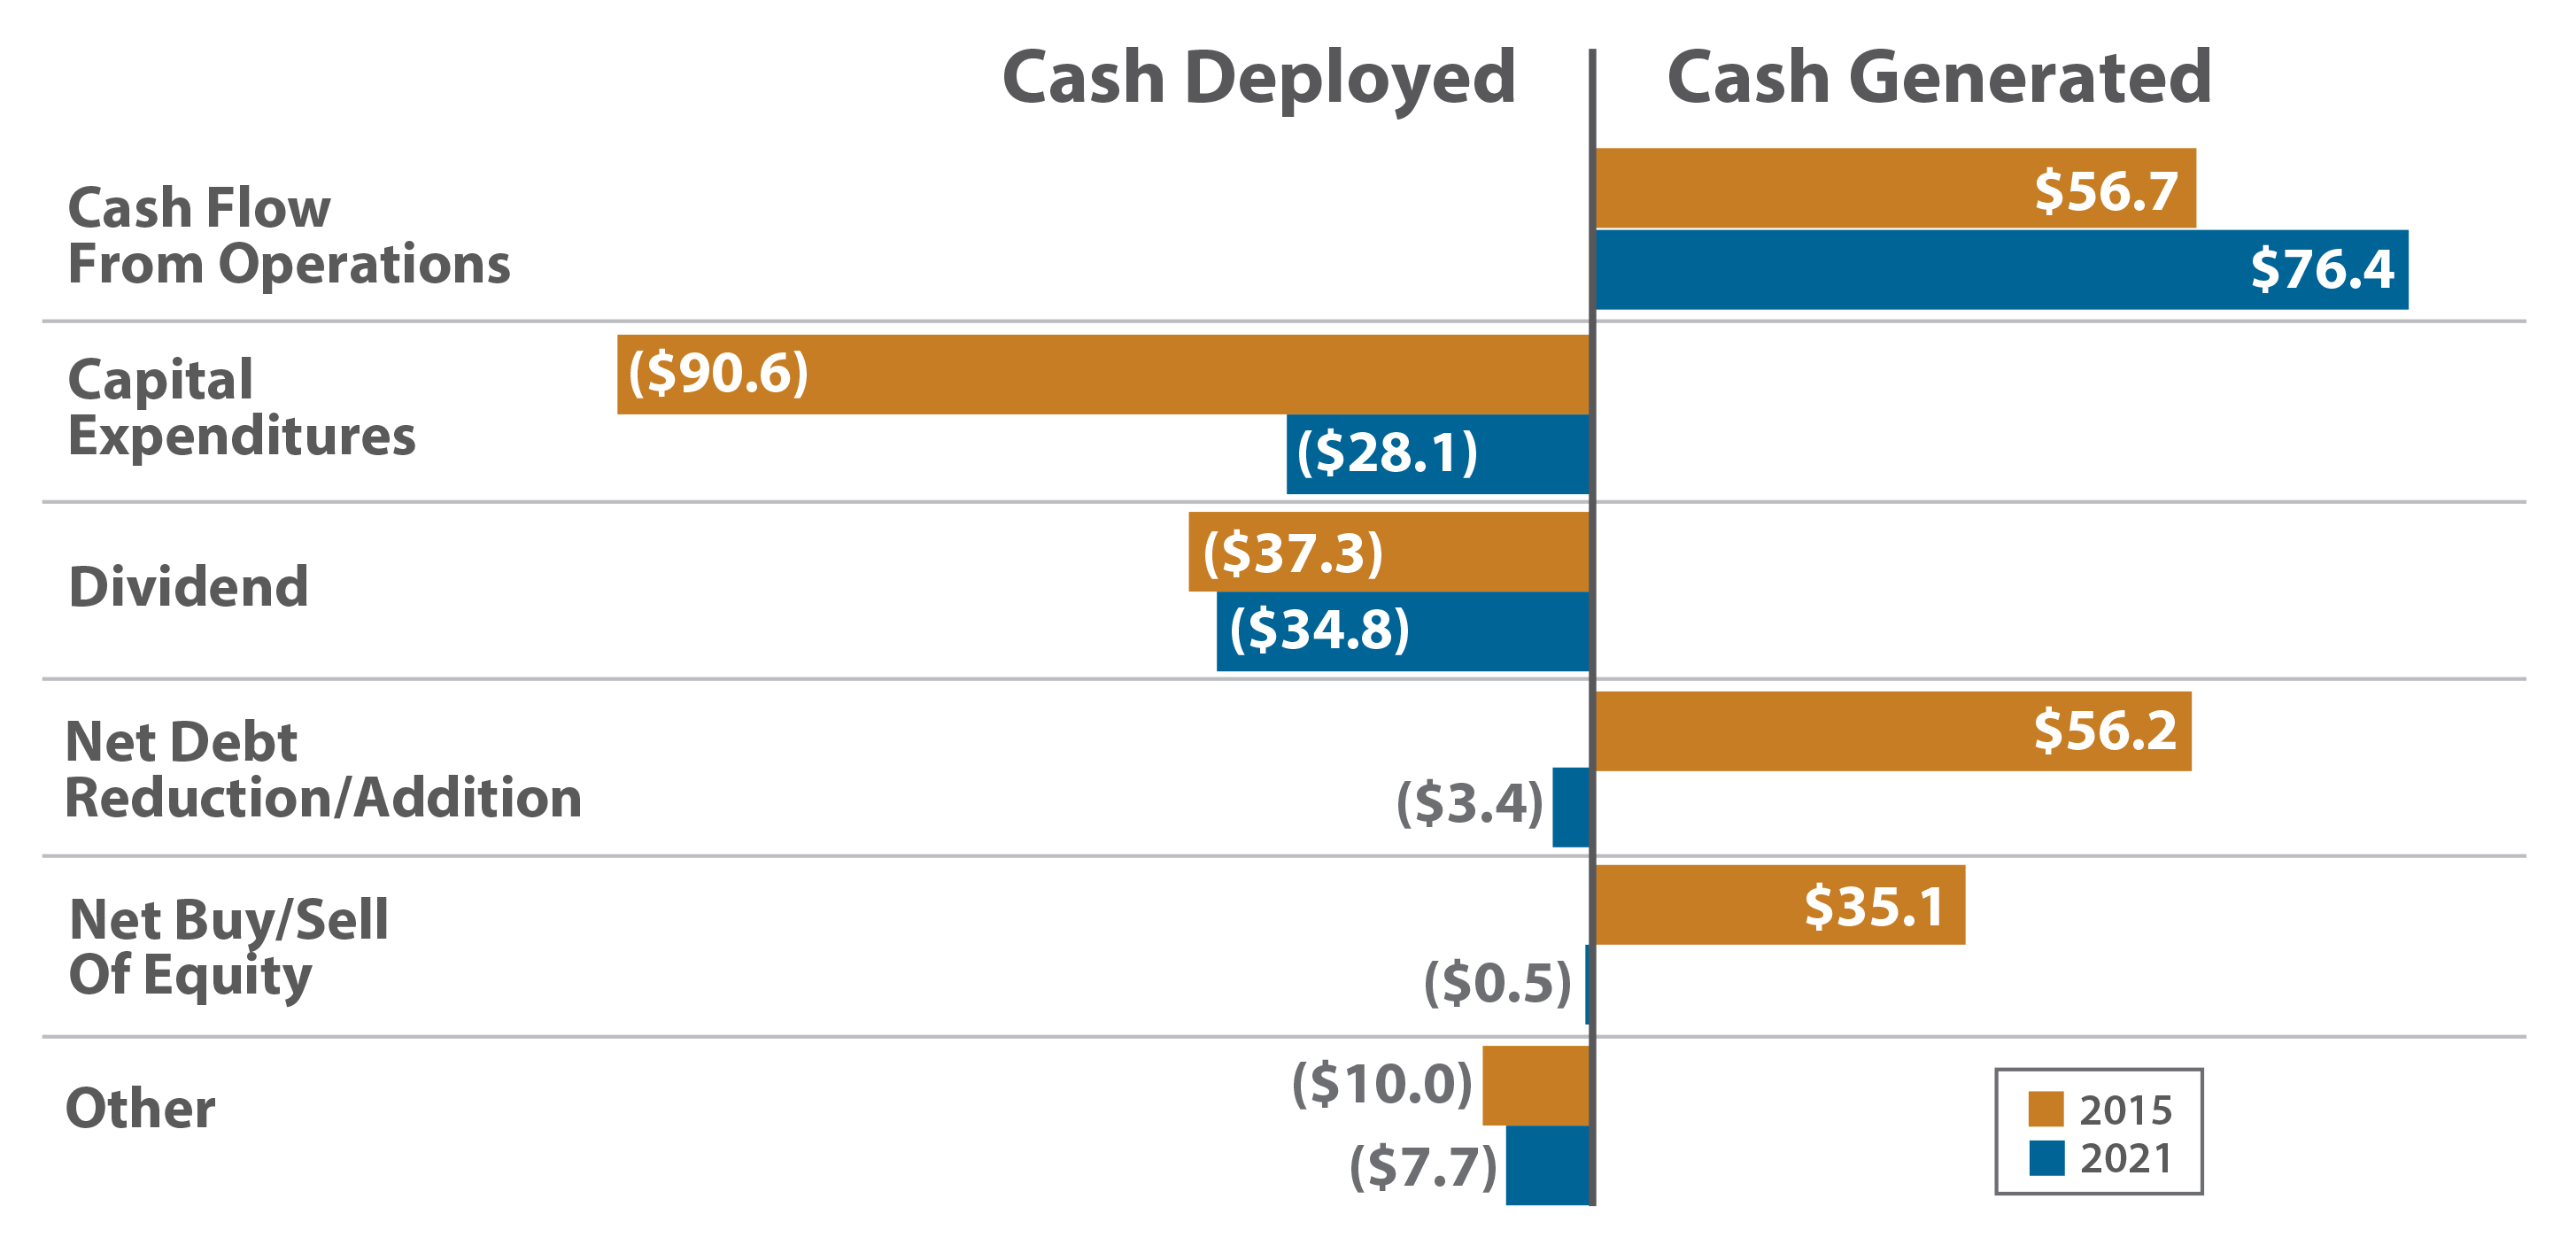
In 2015, midstream companies generated $57 billion in cash from operations. This is the amount of money these company earned from their ongoing, regular business activities. Yet the midstream industry spent a whopping $91 billion on capital spending, primarily to build new infrastructure assets. As a result of this deficit, the industry was forced to sell both bonds and equity to bridge the gap between cash from operations and spending. Yes, the industry paid significant dividends, but that only increased the need for new capital.

Compare that picture to 2021—the industry generated $76 billion in cash flow from operations, yet only $28 billion went to capital spending. Free cash flow was an ample $48 billion last year, allowing the industry to pay $35 billion in dividends—while actually reducing debt by $3 billion and buying back a small amount of stock.

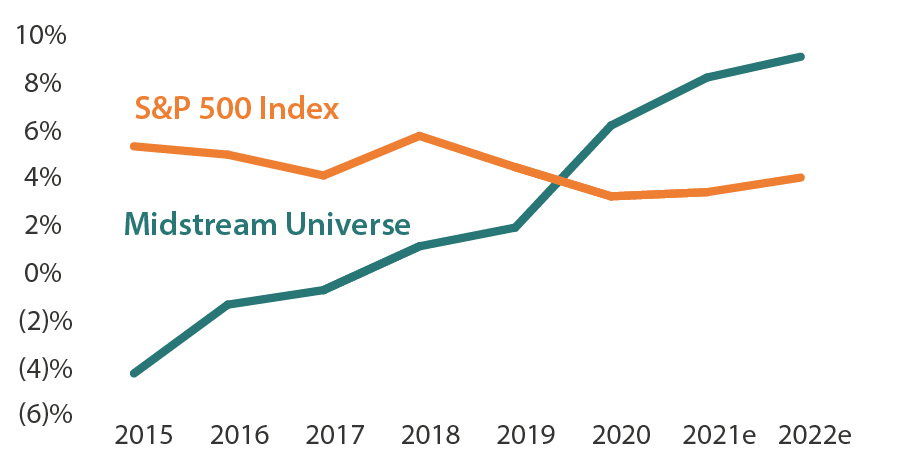
The free cash flow yield is free cash flow divided by market capitalization—meaning the amount of free cash flow an investor sees per dollar of investment. Compared to the broad market, midstream sector’s free cash flow yield is quite attractive in our opinion.

The free cash flow yield for the S&P 500 Index has declined modestly since 2015. On an absolute basis, free cash flow has been increasing in the broad market, but stock prices are up more, pulling the yield down.

But during that time period, the free cash flow yield for the midstream has improved from negative to positive, and since 2019, it has been much higher than the broader market’s free cash flow yield. We believe this suggests midstream stocks have room for price appreciation.

Free Cash Flow Yield
Midstream Universe & S&P 500 Index
Midstream Universe and S&P 500 Index Free Cash Flow Yield

As of November 30, 2021. Sources: Rifinitiv; Bloomberg; Miller/Howard Research & Analysis. For illustrative purposes, 2021 data has been compared against 2015, which was the most recent trough for the midstream industry’s free cash flow.

In our view, strong free cash flow makes midstream distributions secure and creates the potential for healthy distribution increases. In addition to distribution increases, free cash flow can also be used to reduce debt, buyback shares, or pay special distributions.

The midstream industry is healthy. Volumes have largely recovered to pre-COVID levels, and leverage, as measured by debt/EBITDA, continues to decline.

In today’s market, midstream is one of the few asset classes that continues to provide high yields, and high relative income to support investor spending needs. The industry’s focus on free cash flow supports the attractive dividends in the sector in our opinion.

For more information, please see our website at mhinvest.com.

DISCLOSURE

INVESTMENT PRODUCTS: ARE NOT FDIC INSURED - MAY LOSE VALUE - ARE NOT BANK GUARANTEED

Opinions and estimates offered constitute Miller/Howard Investments' judgment and are subject to change without notice, as are statements of financial market trends, which are based on current market conditions. Nothing stated herein, including the mention of specific company names, should be construed as a recommendation to buy, hold, or sell any security, sector, or MLPs in general. To receive a list of all recommendations for the previous year, please email compliance@mhinvest.com. All investments carry a certain degree of risk, including possible loss of principal. It is important to note that there are risks inherent in any investment and there can be no assurance that any asset class will provide positive performance over any period of time. The material may also contain forward-looking statements that involve risk and uncertainty, and there is no guarantee they will come to pass.

Common stocks do not assure dividend payments. Dividends are paid only when declared by an issuer’s board of directors, and the amount of any dividend may vary over time. Dividend yield is one component of performance and should not be the only consideration for investment.

The information above is from sources deemed to be reliable and is provided strictly for the convenience of our investors and their advisors. These materials are solely informational. Legal, accounting and tax restrictions, transaction costs, and changes to any assumptions may significantly affect the economics of any transaction.

The information and analyses contained herein are not intended as tax, legal, or investment advice and may not be appropriate for your specific circumstances; accordingly, you should consult your own tax, legal, investment, or other advisors, at both the outset of any transaction and on an ongoing basis, to determine such appropriateness. Any investment returns — past, hypothetical, or otherwise — are not indicative of future performance.

Investment Decisions: Do not use this report as the sole basis for investment decisions. Do not select an allocation, investment discipline, or investment manager based on performance alone. Consider, in addition to performance results, other relevant information about each investment manager, as well as matters such as your investment objectives, risk tolerance, and investment time horizon.

The returns on a portfolio that utilizes environmental, social, or governance (ESG) criteria for stock selection may be lower or higher than portfolios where ESG factors are not considered, and the investment opportunities available to such portfolios may differ.

Past performance does not guarantee future results.

© 2024 Miller/Howard Investments.